The Home screen of the Vision Portal ( >> Home) shows an overview of your Vision data, including the number of trips for the selected time range, the distance traveled, which drivers have the best and worst records (the fewest and most Vision violations), and which drivers might need more training.

The controls at the top right enable you to change the date range of data being shown and show only certain tagged events (if you have added tags on the Configurations page, as shown in Configuring Event, Coaching, and Tag Settings).
The summary tiles show the number of trips in the time period, the distance driven, the average count of violation events per each 100-mile segment (plus a percentage indicator showing if that number is up or down), and the number of hours of travel time.
The Recommended for Coaching section shows the video for the most severe incident incurred by your drivers in the time range for each type of Vision violation event. To show only one category of infraction, you can click the Select Event drop-down arrow at the top right of the section and choose the type you want to see.
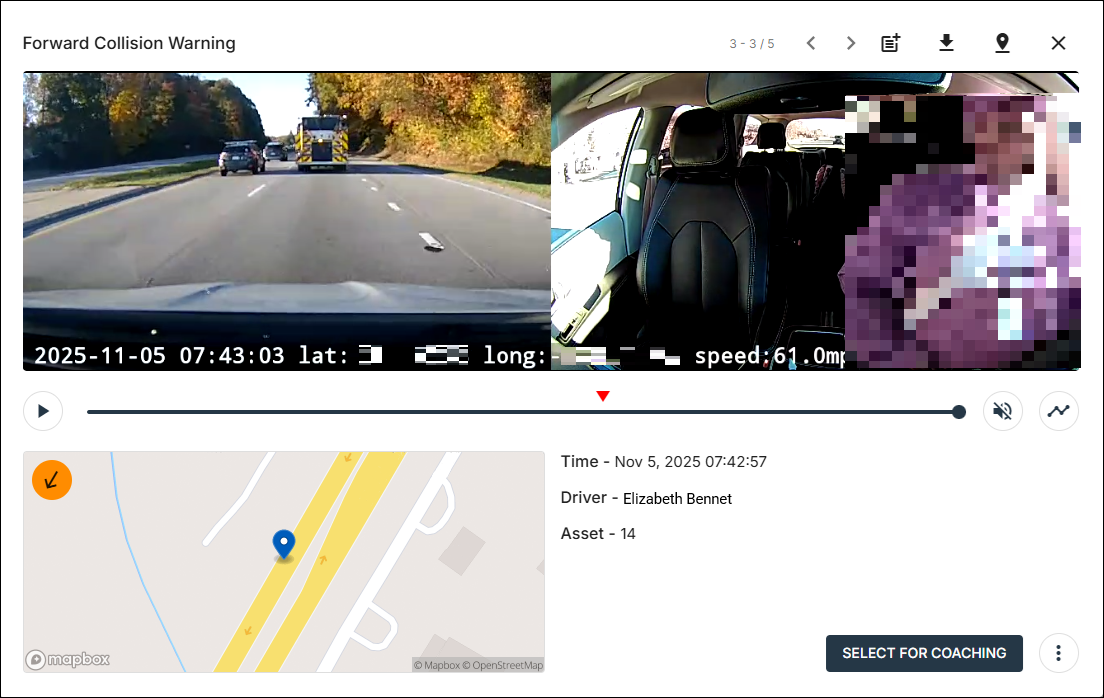
You can click a video in the Recommended for Coaching area to open and play it in its own window.
The controls at the top right offer these options:
 Tags and Comments: Opens up tags and comments associated with the event (if available).
 Download Video: Downloads the video to your computer.
 View Trip Details: Opens the Trip Details window for the event, which shows the path the bus took on a map and a list of all the violations for the trip, plus the time they occurred. (See Viewing Trip Details.)
 Close: Closes the video window.
You can click Select for Coaching to add the driver to the Coachable Drivers list, which is a tool to highlight which drivers need extra training due to certain traffic violations and to log when they completed that training. (See Using the Coaching Screen for details.)
On the Home screen, below the Top Drivers and Coachable Drivers tiles are these widgets:

- Event Summary: A pie chart of all the Vision events/violations, with each wedge representing an individual infraction's percentage of the total number of events. You can mouse over a wedge to show more details for it, such as the count for your chosen time range.
- Event Trend: A line graph showing the total number of events from day to day. You can click the Select Events drop-down arrow and choose just certain violations to be displayed.